I've spent a ton of time now writing up code to do periodograms and power-spectrum analysis on my star-spectra. (wikipedia:
spectral-density acoustics). I'm essentially looking for any sort of periodic variation in the star to see if I can detect the star's rotational period, or any sort of cyclic variation in the stellar wind. It's actually been really nice to do this - I've been able to write an entirely different type of code, which, for code-monkeys and data-bitches, can be a big relief when all one usually does is process spectra and make plots. I actually got to do some math and test out a type of analysis that I've never done before. Geeky? Of course.
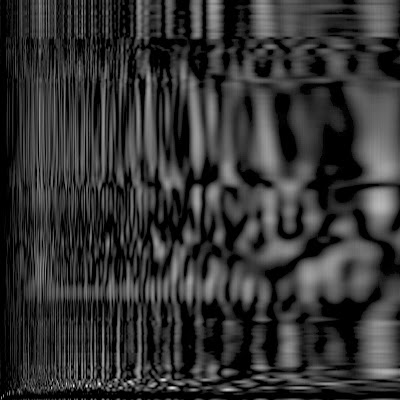
Here's the "variation" of my spectral line with some fake implanted periodic stuff on the left.

Basically, this is the core of the code that processes the variation above:
FOR per=0,num_periods-1 DO BEGIN
y=SIN(2*omega(per)*jd)
x=COS(2*omega(per)*jd)
tau=TOTAL(ATAN(y,x)/2/omega(per))
FOR i=0,numset-1 DO BEGIN
cos_sum( per, i)=COS(omega(per)*(jd(i)-tau)^2)^2
sin_sum( per, i)=SIN(omega(per)*(jd(i)-tau)^2)^2
cos_term(per, i, *)=moddata_resid(i,*)*COS(omega(per)*(jd(i)-tau))
sin_term(per, i, *)=moddata_resid(i,*)*SIN(omega(per)*(jd(i)-tau))
ENDFOR
ENDFOR
ct=TOTAL(cos_term,2)^2
cs=REBIN(TOTAL(cos_sum,2), [num_periods,numpixel])
st=TOTAL(sin_term,2)^2
ss=REBIN(TOTAL(sin_sum,2), [num_periods,numpixel])
sig_arr=TRANSPOSE(REBIN(sig, [numpixel,num_periods]))
periodogram = (ct/cs + st/ss)/2/sig_arr
Which produces an "image" of the power (grey scale) at each frequency (horizontal) for each color (vertical). Basically, this is a bunch of noise and junk as far as I can tell. Nothing obvious.... but I did find my fake data just fine down in the lower left. At least the code works.

Here's the start of the paragraph I put in my paper about it.

Anyways, I've spent a few days now trying different methods, writing this code, testing it, running it and writing it up. That about sums up my life the since Sunday.


